

Service Name: Cell Detection and Statistical Analysis with Associated Regions of the ARA
Methods Overview
• Method 1: based on the MATLAB environment
• Method 2: based on the Imaris software
Introduction of the First Method
This method provides accurate and fast results for cell nuclei and for immunohistochemical staining of neurons, astrocytes, and immune cells in the mouse brain, with respect to the associated regions of the Allen Brain Reference Atlas (ARA). It is not applicable to 3D data.
Advantages
1. Easy to install and operate; no need to identify or name brain regions.
2. Easy to detect signals of the 3 RGB channels independently; can also be used for colocalized signal detection.
3. Accurate and fast batch analysis of 2D data.
Procedure

Atlas-to-Slice Transformation
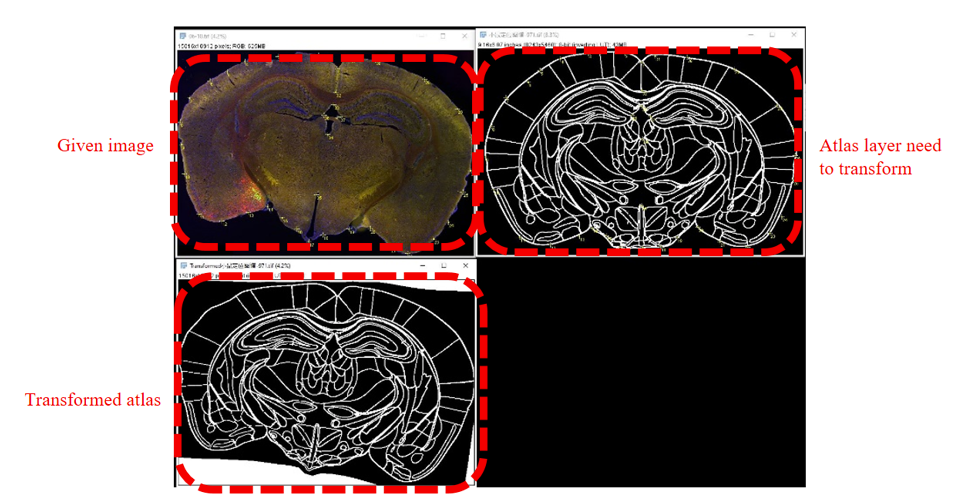
After transformation, the pixel number and size of the atlas layer will be consistent with the given image.
Results
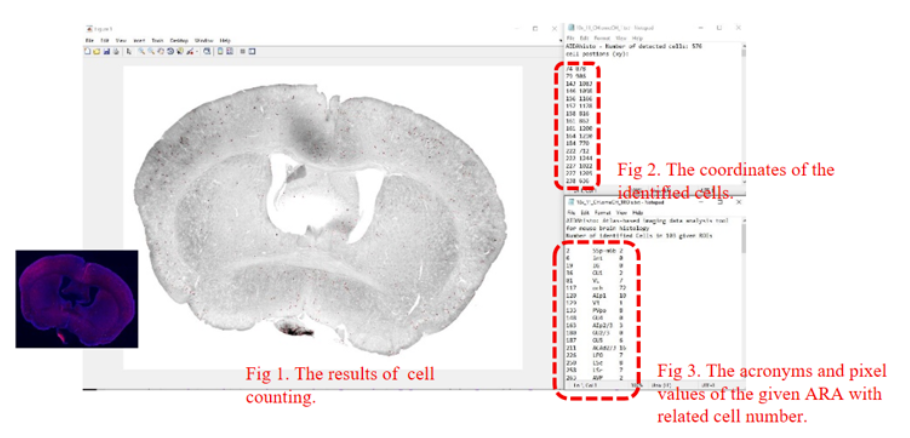
The output consists of three parts: Figure 1 shows the cell detection result, where the red spots represent the identified cells and can be compared with the red-channel signal of the original image; Figure 2 is a table listing the XY coordinates of all identified cells; Figure 3 is a text file containing the acronyms and pixel values of the given ARA together with the corresponding cell numbers.
Introduction of the Second Method
This method is suitable for identifying cells or other structures in 2D data (not applicable to 3D), and can also statistically output cell counts for the associated brain regions.
Advantages
1. High degree of visualization of the results.
2. High detection accuracy with versatile tunable parameters for defining the detected structures.
3. Multi-channel recognition; can also perform colocalization analysis.
Procedure
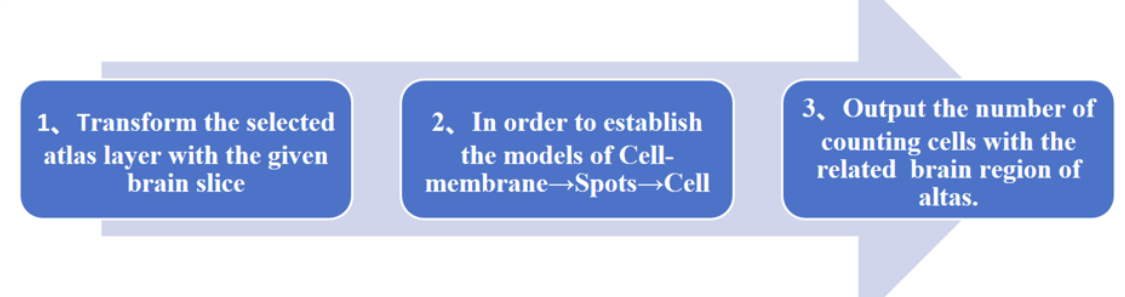
1. Transform the selected atlas layer with the given brain slice
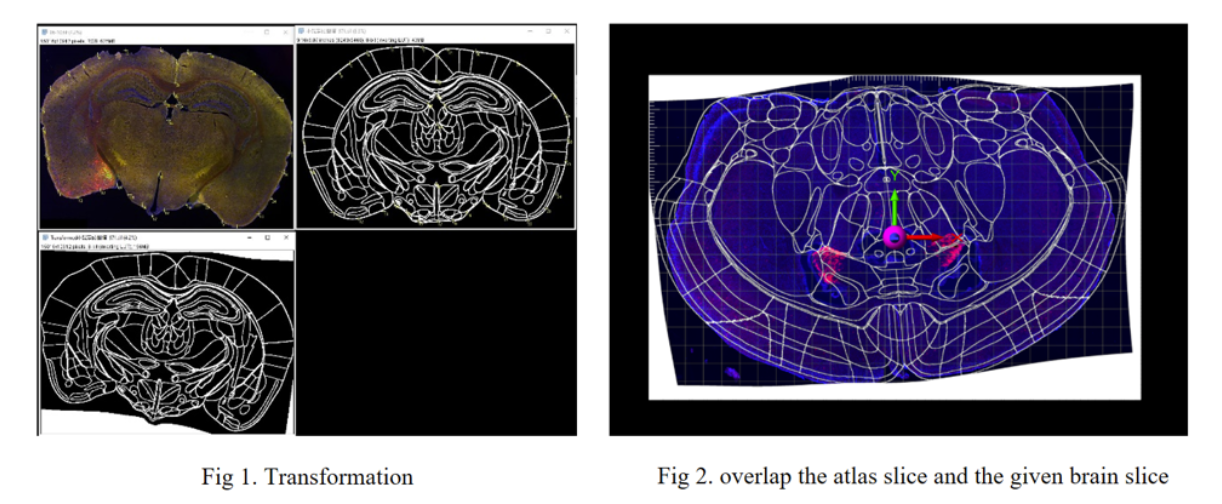
Figure 1 shows the result of transforming the selected atlas slice so that it has the same shape, pixel size, and pixel number as the given brain slice. On top of that, the transformed atlas slice and the given brain slice are spatially overlapped, as shown in Figure 2.
2. Establish the Cell-membrane → Spots → Cell models in sequence
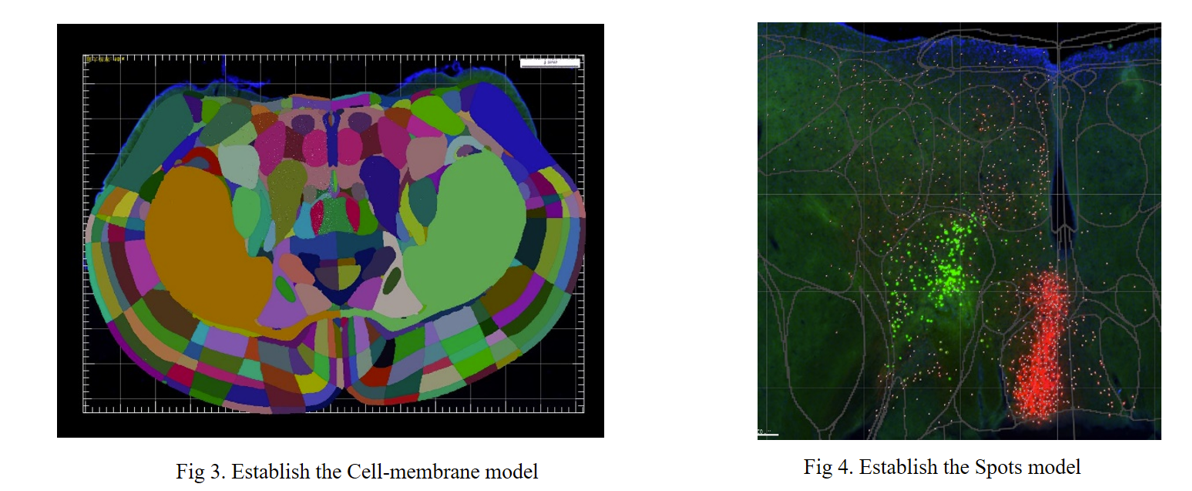
The above is the output display of brain-region division and cell identification, along with the cell numbers in each brain region of the atlas. Figure 3 shows the division of each brain area — different colors represent the different regions recognized by the Cell-membrane model. Figure 4 shows the cell identification results of each signal channel using the Spots model.
3. Output the cell counts for the associated brain regions of the atlas
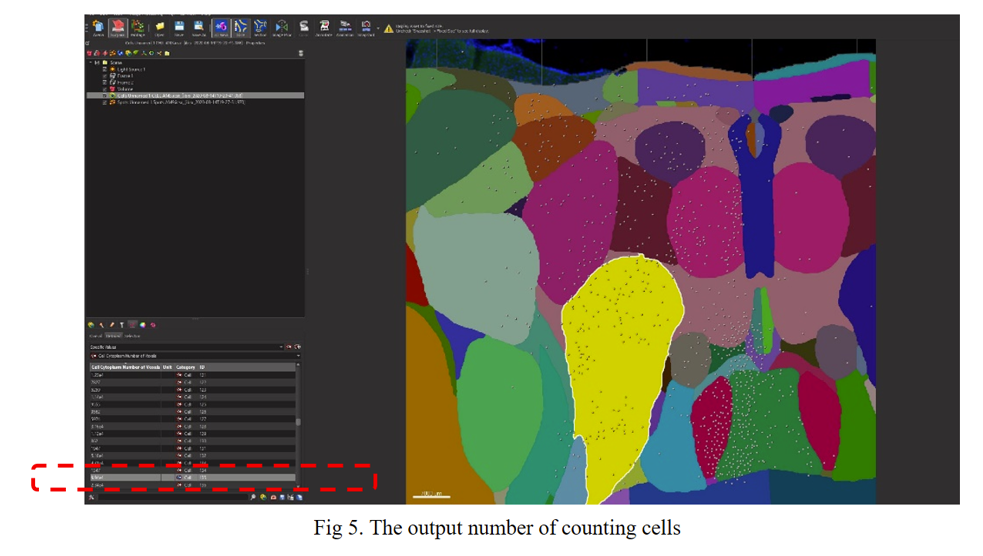
Figure 5 shows the cell-count statistics. Click any identified brain area on the right to view the number of identified cells on the left.


Address :Chinese Institute for Brain Research, Beijing(CIBR), Jianzan Building, No.26, Science Park Road, Zhongguancun Life Science Park, Changping District, Beijing, China
-
Contact:010-80765986 Postalcode:102206
© 2023 by Personal Life Coach. Proudly created with Wix.com ICP备案号:京ICP备18029179号