

Introduction
This page introduces the following three tools for analyzing average fluorescence intensity changes in time-series data:
CalmAnalyzer (Matlab)
Calcium Imaging Analyzer (Fiji)
Voltage Imaging Analyzer (Fiji)
CalmAnalyzer
Method Description
This method is mainly used to analyze the average fluorescence intensity change of the ROI area in the time series. According to the circled ROI, this method can quickly output the results of the average fluorescence intensity change curve of each ROI area, the median change curve of average fluorescence intensity, and the change-rate heat map. The method includes a GUI interface and is implemented in Matlab, making it easy to operate.
GUI Operation
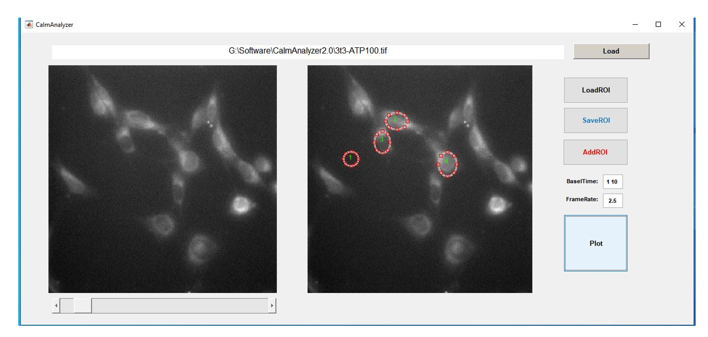
According to the on-screen prompts, load the data → add ROIs → set the BaseTime and frame rate.
Output
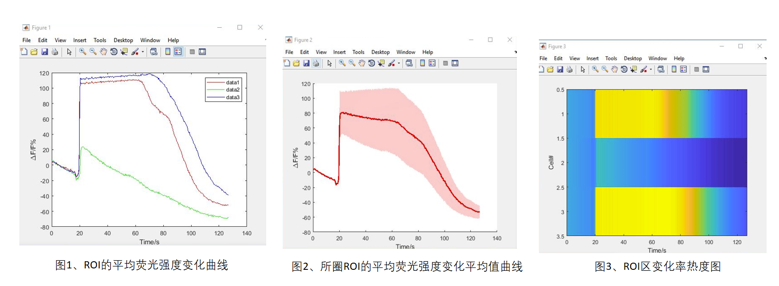
Fig. 1. The change of each ROI mean fluorescence intensity. Fig. 2. Average fluorescence intensity change curve of all the circled ROIs. Fig. 3. Heat map of the rate of each ROI change.
With one click, the average fluorescence intensity change curve of each ROI, the average change curve of all ROIs, and the heat map of each ROI change rate are output based on the selected ROIs.
Calcium Imaging Analyzer
Method Description
This method is mainly used to analyze the average fluorescence intensity changes in the ROI area of the time series. Based on the circled ROIs, it can quickly output the average fluorescence intensity change curves of each ROI area. Implemented in Fiji, it is easy to install and operate.
Fiji Operation
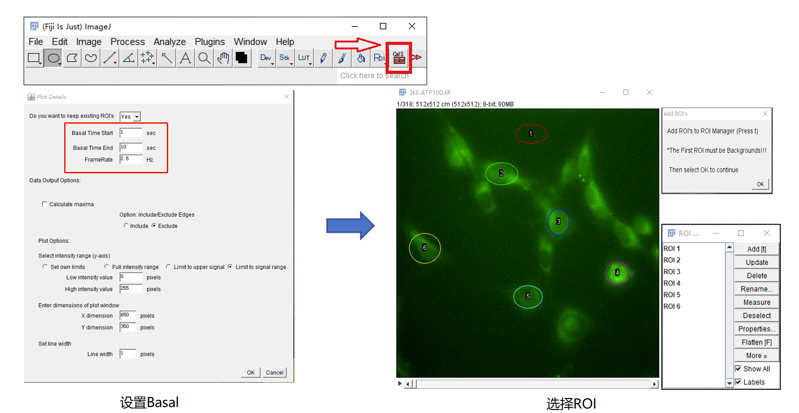
Set Basal → select ROI; following the on-screen prompts, load the data → set the BaseTime & frame rate → add ROIs.
Output
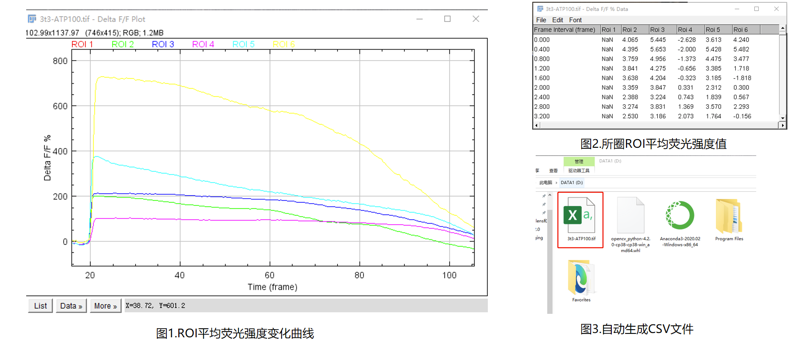
Fig. 2. Average fluorescence intensity change curve of the ROI. Fig. 2. Average fluorescence intensity value of the circled ROIs. Fig. 3. Automatically generated CSV file.
Based on the selected ROIs, it outputs the average fluorescence intensity change curve of each ROI, the average fluorescence intensity value of the circled ROIs, and the corresponding CSV file, facilitating later data analysis.
Note: this plugin is modified and implemented based on the Fiji macro toolkit from the Imperial College Imaging Centre.
Voltage Imaging Analyzer
Method Description
This method is mainly used to pre-process and display the voltage signals of neurons labeled with Voltron. It first performs bleach correction on the signal, then calculates the corresponding SNR. Based on Fiji, it is easy to install and use, and can quickly analyze and display the signals.
Fiji Operation
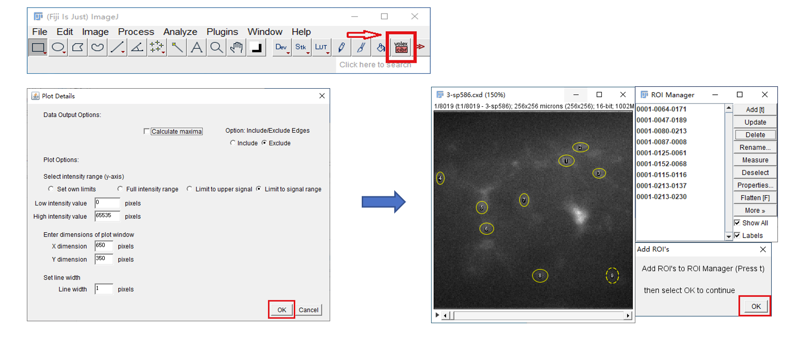
Following the on-screen prompts, add multiple ROIs and click OK to start the calculation.
Output
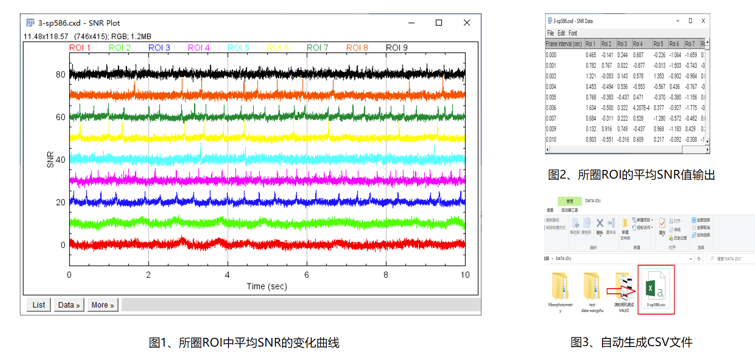
Fig. 3. Change curve of the average SNR in the circled ROIs. Fig. 2. Output of the average SNR value of the circled ROIs. Fig. 3. Automatically generated CSV file.
Based on the selected ROIs, it generates the SNR change curves of multiple ROI areas, the average SNR value of the circled ROIs, and the corresponding CSV file, facilitating later data analysis.
Note: this plugin is modified and implemented based on the Fiji macro toolkit from the Imperial College Imaging Centre.


Address :Chinese Institute for Brain Research, Beijing(CIBR), Jianzan Building, No.26, Science Park Road, Zhongguancun Life Science Park, Changping District, Beijing, China
-
Contact:010-80765986 Postalcode:102206
© 2023 by Personal Life Coach. Proudly created with Wix.com ICP备案号:京ICP备18029179号